RequestMap Info
RequestMap uses Chrome request data from WebPageTest to visualise the requests on a page.
This service is intended as a proof-of-concept to help identify third-parties on a page and where they are called from.
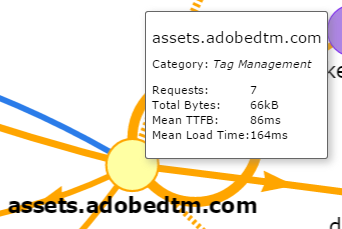
Hover on a node or edge to get more detailed information. Right-click on the chart to save it as an image.
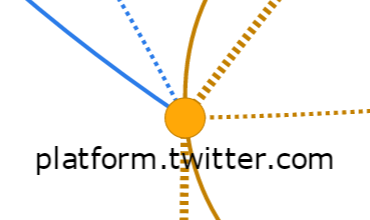
 | The nodes in a requestmap represent domains. The size of the node represents the percentage of transmitted bytes from that domain. |
 | The edges in a requestmap represent requests between domains. The length of the edge represents the mean TTFB of the target domain. The width of the edge represents the number of requests between the domains. Dashed lines represent requests initiated from a script or identified through a referer header. |
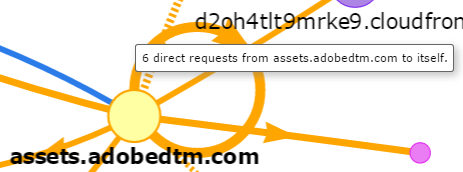
 | Looped edges represent requests initiated from the same domain. |
If you have any questions or comments please tweet me.